







This title is in fact a quote from Benjamin Disraeli one of the great British Prime Ministers. Statistics can be manipulated presented and misused at wish. His equally worthy heir, Winston Churchill, is reported to have quipped in a fit of rage that “the only statistics you can trust are the ones you have falsified yourself”
As we write today, on the basis of 5th April published figures, recorded at midnight on the 4th midnight GMT, we are informed that five nations have already overtaken China in the number of confirmed Covid-19 cases: the US almost 4 times the Chinese figures, Italy and Spain 50% over and Germany and France slightly over. However, the death statistics in these countries, except for Germany, far exceed those of China. Even the UK with half of the reported cases has more fatalities than China. This poses all sort of questions about the values of these statistics to gauge the severity of the situation. Already conspiracy theorists use these gaps to propagate more fog on this epidemic, that needs enlightenment rather than distorting.
In a previous article, “The Chinese viral Odyssey” we explained how most of the recorded (85-90%) cases in China had occurred in the Hubei province, which had been completely isolated room the rest of China, and that the rest of China had been able to contain the spread of the virus. It was also explained that some of the early cases and deaths may not have been ascribed to the virus as it was an unknown pathogen.
As the death rates rise dramatically in the West dwarfing the Chinese figures, conspiracy theories circulate to demolish the regime’s credibility. Figures of 60,000 death due to coronavirus are circulating in the social media. It is impossible to verify the figures, but a little perspective might blow away those unsubstantiated claims. They base their claim on the fact that the number of urns containing the ashes of dead people released in the Hubei province far exceed the number of people recorded to have died from the virus. What they seem to forget is that there was a total shut down in the whole province. According to the South China Morning Post, Wuhan, a city of about 11 million people in the province of Hubei, went into lockdown to try to control the spread of the coronavirus on January 23, a measure that included suspension of all funeral and mourning activities. The mortality rate in China is about 0.73% and Wuhan demographics in terms of elderly versus younger people are similar to that of the Chinese nation. Over a period of slightly over two months, the normal death numbers should be around 14000 souls to which one should add some 2500 other to account for the virus fatalities. Although one cannot discard that the statistics may be on the low side it is appropriate to examine the casualty rates in some representative countries.
We show below a table displaying the reported cases, the deaths and their percentages, in relation to the reported cases. We have also included the same percentages from the week before. It is apparent that those percentages increase with time, as the number of deaths occur with a delay but at a faster rate than the reported cases as the epidemic matures. When the epidemic is almost complete like in China and Korea, the percentages stabilize.
| Country | Reported Cases | Deaths | % of rep. cases | % of rep. cases |
| 6th April | 6th April | 6th April | 31st March | |
| Italy | 128948 | 15889 | 12.32% | 11.39% |
| UK | 47810 | 4934 | 10.32% | 8.17% |
| China | 83005 | 3340 | 4.02% | 4.05% |
| USA | 307318 | 8358 | 2.91% | 1.92% |
| Germany | 95391 | 1434 | 1.5% | 1.00% |
| Korea | 10284 | 186 | 1.81% | 1.66% |
| Greece | 1735 | 73 | 4.21% | 3.55% |
Germany stands out as the lowest death rate and this may have been the results of several factors including high ICU capacity, extensive testing (about 50000 tests per day), early detection and isolation. Many of the early contaminated persons were identified as young people returning from skiing holidays. Their early isolation may have limited the spread of the epidemic to the elderly who are more likely to succumb as results of complications. Hence the lower death rate at this stage.
Please note that at this stage the percentage of deaths relative to reported cases is much lower than the ones from China. Whereas Chinese data may be regarded by some as controversial, there can be no doubt about the transparency of the South Korean figures of reported cases since they carried out the most intensive testing in a per capita basis of any nation. We therefore are incorporating the Korean data in our today graphs, even though the epidemic is till going on, albeit at a slow rate.
On the left hand graph, we have plotted the daily infection and death rates and for clarity’s sake, on the right hand graph the infection rate on a 1/10 scale and the death rate on a 1/1 scale so as to give a better inkling of the relative shapes of the curves. The Korean crisis appears to be waning but is not quite terminated. If the peak on infections and hospital crisis equipment appears to have passed, the fatalities will continue to trickle as, still today, many acutely suffering patients are maintained under ventilators.
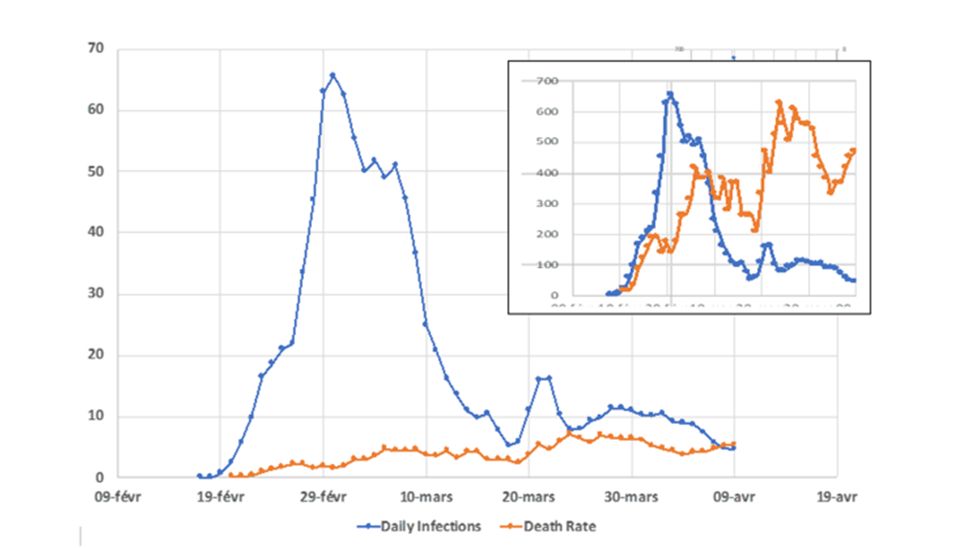
It is worth noting that the peak in fatalities occur some 3 weeks after the peak in reported case. Patients that become severely afflicted enter hospital about a week after the first symptoms. For the more unfortunate ones they go into artificial respiration with ventilators a few days later and it may take 10 to 12 days before they escape or succumb. Although we do not have data on people under artificial respiration it is fair to expect that about 5-8% of the cases undergo that crucial stage. It should therefore be possible based on accurate statistics to construct model that anticipates the mortalities.
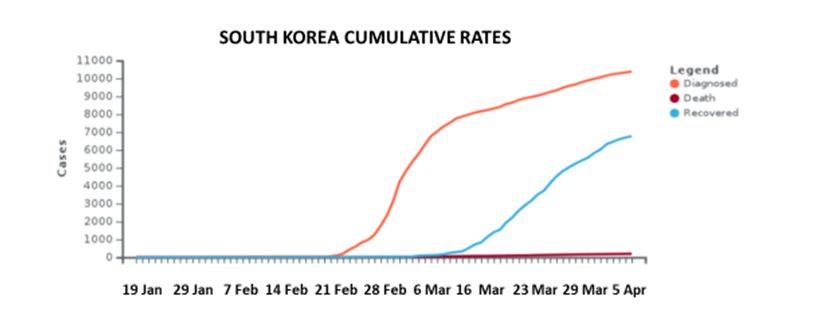
This curve found on the internet displays the Korean cumulative number of cases of infections (orange) the number of recovered (blue) and the fatalities (crimson). Just as the curves we produced, it illustrates the lag in fatalities. The number of new cases has reached its point of inflection over a month ago but still rises at a slow rate. What is interesting is the recovered numbers blue line is still far away from almost meeting the orange line. The actual epidemy will end when the blue line almost meets the orange line. What is missing on this graph is a fourth curve: the outstanding cases curve i.e. the differential curve which is the curve obtained when one subtracts the number of deaths from the number of infection cases.
It is too early to make judgements on the relative casualty rates as so many epidemics are still taking their course. What is apparent is that deaths continue for a few weeks even after the epidemic has been mustered. It is therefore unfortunately premature to rejoice at the first drop in fatalities as has been the case in recent days both in New York and Italy. Moreover, there are many unknown factors such as the age of the patients, their underlying health conditions and probably more crucial the degree of overburden on the medical infrastructure, often caused by an inadequacy in preventive measures before the start of the outbreaks.
It can also be asked whether the discrepancies in rates between the West and Asia can be related to the degree of testing and accuracy in the number of reported cases and to a lesser degree to the number of deaths improperly ascribed to another cause. Germany has an intense testing rate, by far the highest of any Western country and it appears to have not only contributed to more accurate numbers of actual cases, but enabled early identification of carriers and therefore limited the extent of infections. The death rate is a function of many different factors not least the capacity of ICUs and ventilators and the age/ underlying condition of infected patients.
Even though Wuhan has just reopened after 76 days of drastic lockdown enforced to a degree not possible in the West, the death reported continues to trickle daily at a rate of 2 per day. What can be said is that once they recognised the dangers of the virus, even though with a probable two weeks delay, they reacted forcefully and kept WHO, the World Health Organisation, fully advised. In most western countries the epidemic was left to spread for any weeks before authorities reacted. We will revisit the issue in a future article.
Once the whole epidemic is over and thorough statistics are available, more appropriate conclusions may be drawn. May be the China statistics given their early and stringent response will be proved to be not so flawed after all. May be the Chinese authorities will be able to revise or add to the numbers in the very early period.
WE ARE ALL ON THIS TOGETHER, YES MR TRUMP!
| By Digenis | 13 April 2020 |